Track Head Impacts + Fitness.
Schedule your Scan 801-542-9816
Classic Custom, or Fitness & Impact Tracking.
Custom mouthguards are proven to improve airway and stay in place even after impact.
PlaySafe Custom EVA-$175
Team Price (3 or more athletes) $175 Individual Price $205
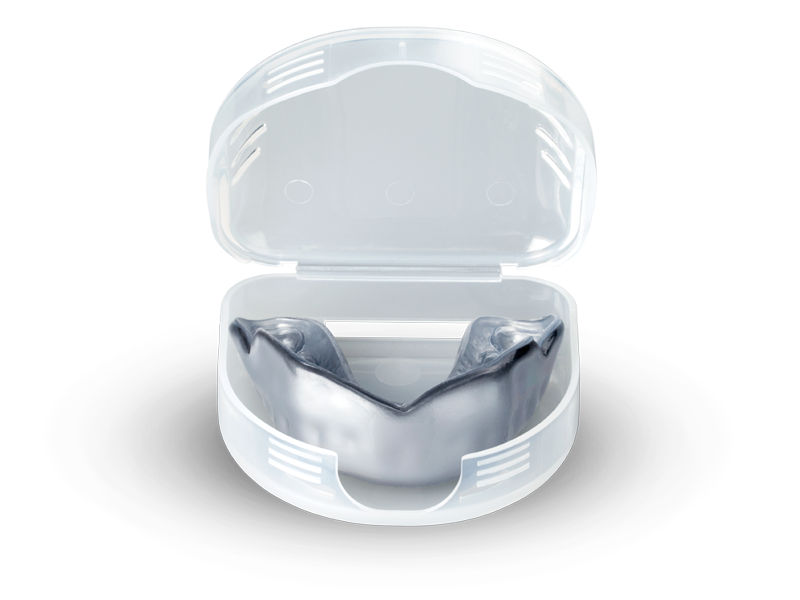
Time-tested protection. Professional-grade custom fit without the tech. Trusted by athletes for decades. Protection is increased by layering sheets of EVA. Custom colors available.
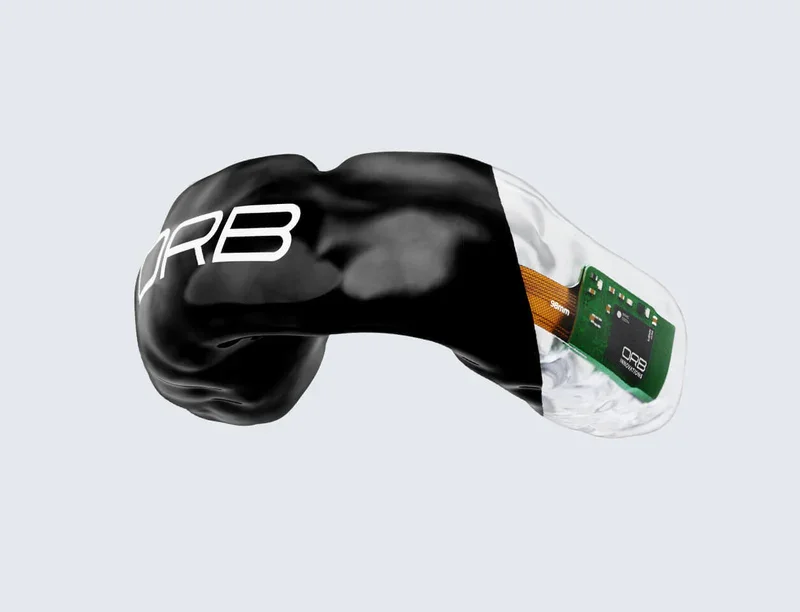
Orb Sport-$350
Team Price (3 or more athletes) $350. Individual Price $400. App fee may apply. Loss insurance available.
Outfit your entire team with custom fitted mouthguards without disrupting practice. We bring professional scanning and fitting services directly to your facility, or schedule your team at our South Jordan office. ORB Sport mouthguards are now exclusively available through dentists, and we're one of the few providers offering convenient team fittings with same-day scanning. We offer team service in Salt Lake, Davis, Utah, Weber, and Tooele counties. To schedule a team (3 or more athletes) scanning event call 801-542-9816. For individual orders call 801-542-9816 to schedule your scan, and ask about our concierge in-home scanning options.
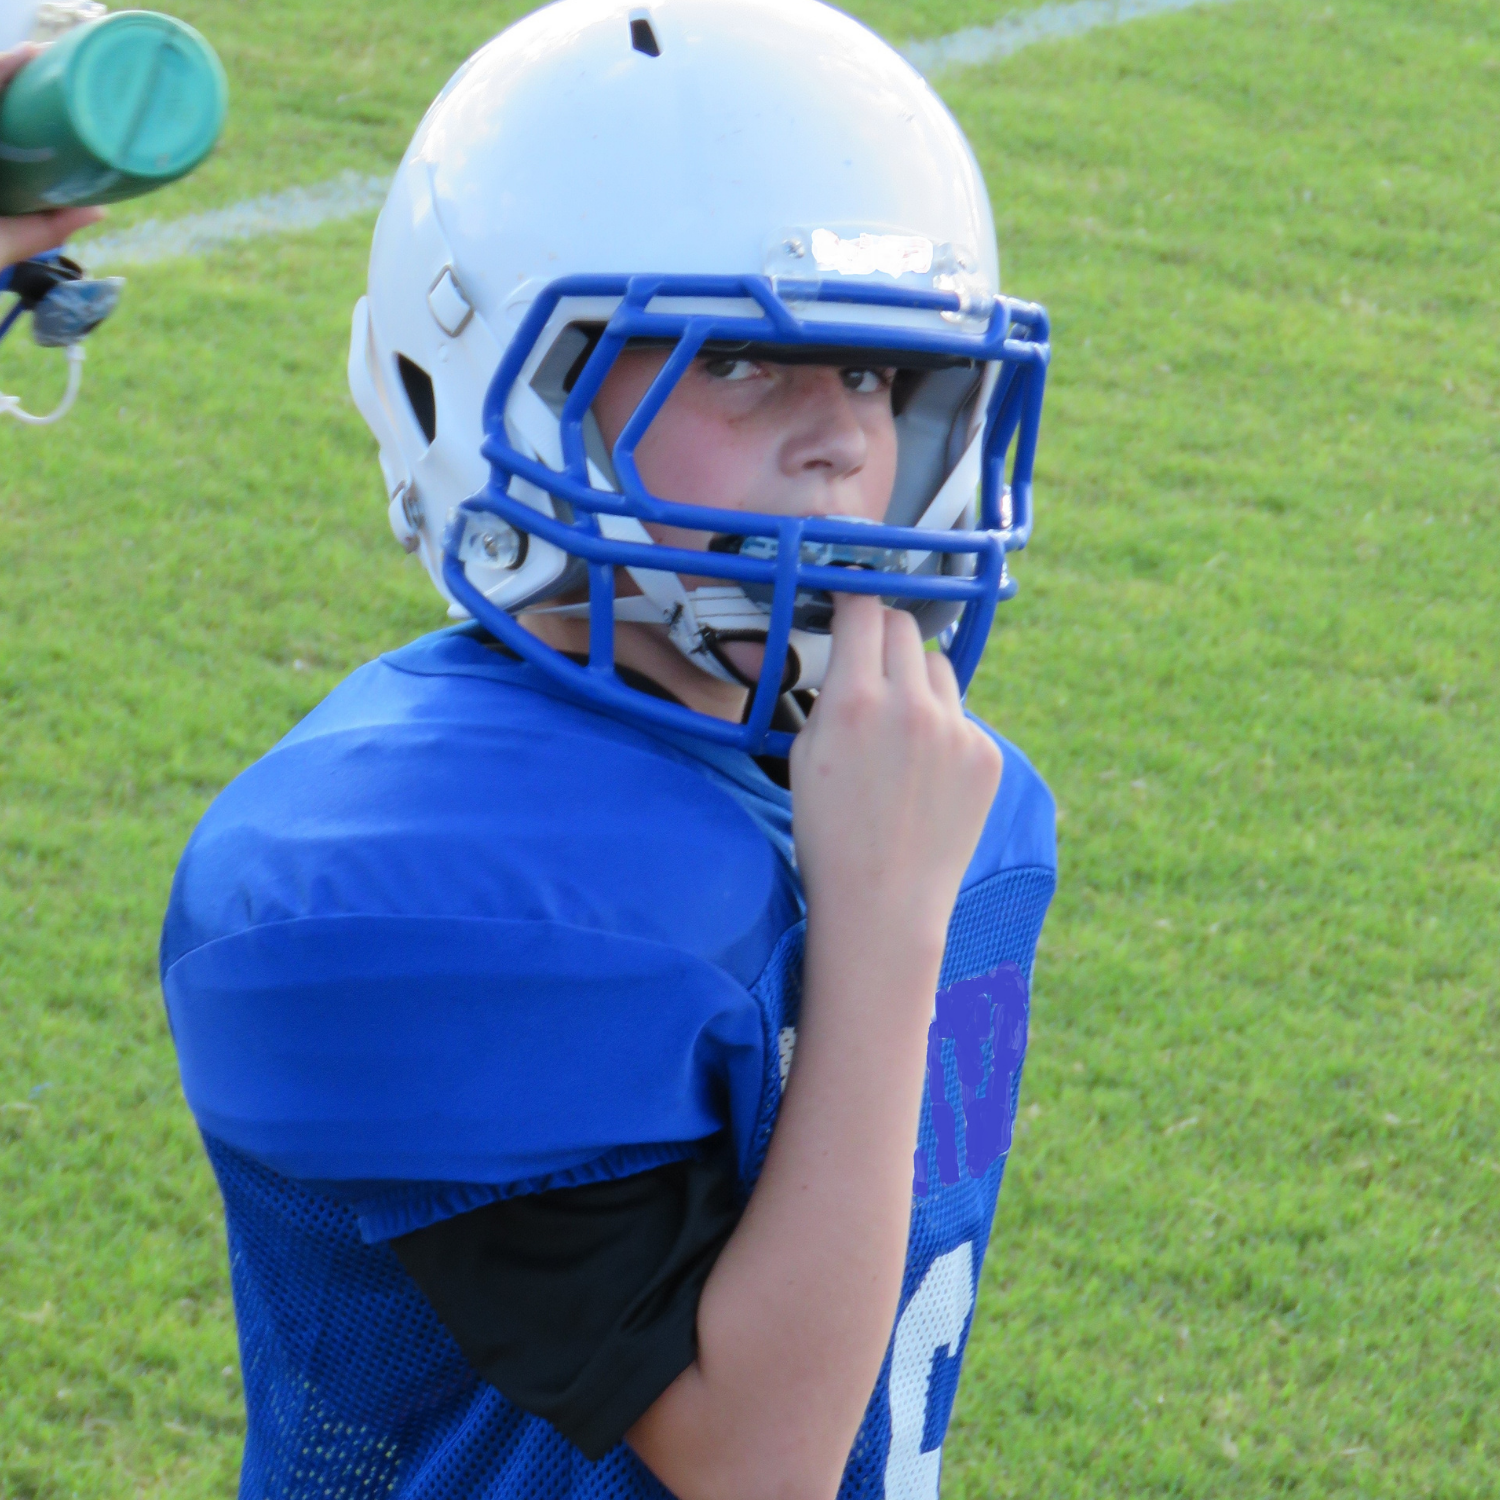
Get your team ready. Come to us, or we’ll come to you.
Impact & fitness tracking. Monitor head impacts, heart rate, and performance metrics in real-time. Now only available through dental professionals.
Orb Sport: Track Every Impact. Protect What Matters Most.
ORB Sport is the only mouthguard that monitors head impacts in real-time, giving parents and coaches critical data about contact frequency and severity. With built-in sensors tracking fitness metrics, heart rate, and impact force, you'll know exactly what's happening on the field—not just after an injury, but before one occurs.
Every parent wonders is contact sports are safe for their child. Get objective, measurable metrics to make informed decisions about play time, rest, and when to seek a medical evaluation. Knowledge is protection.
Orb Sport Metrics.
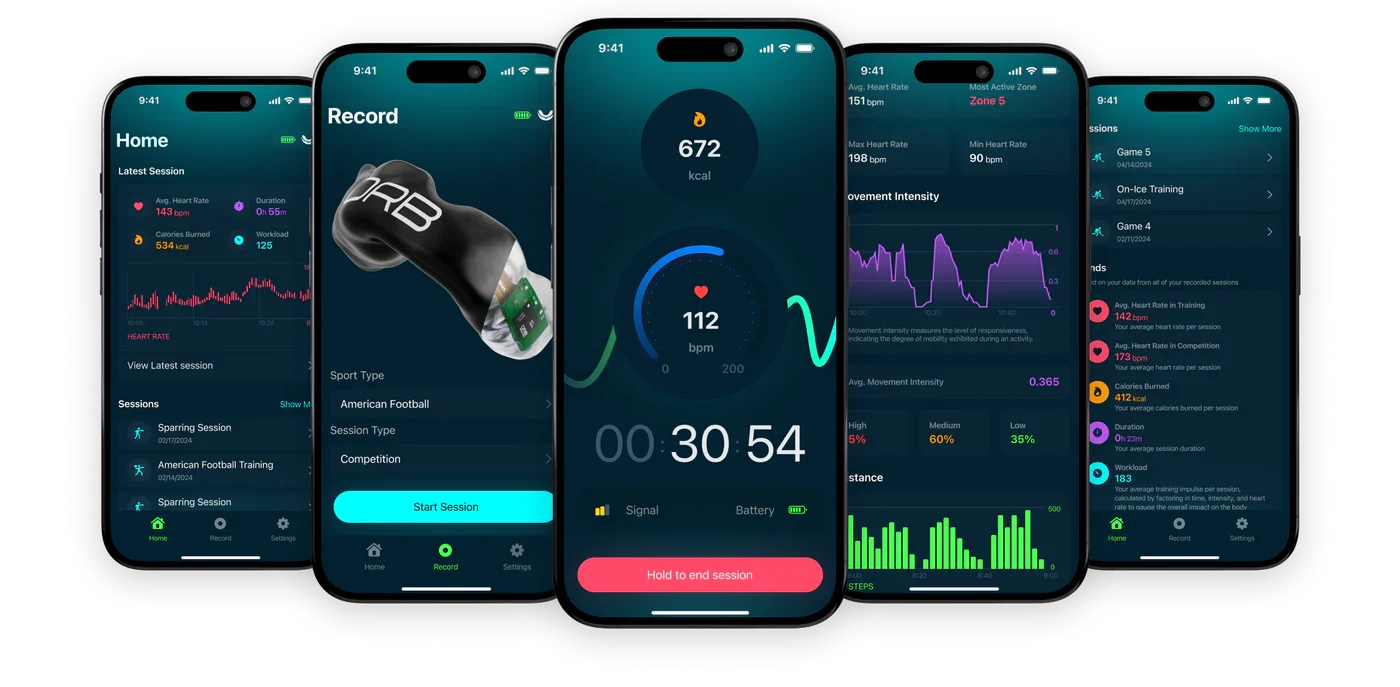
Heart Rate
Once a session is recorded, you can view your heart rate and analyze the time spent in each heart rate zone. We also provide key heart rate data, including minimum and maximum rates and your most active zone.
Heart Rate Chart
This graph presents a visual representation of your heart rate throughout the session. It dynamically scales to offer a clear view of how your heart rate responded during various phases of activity. Gaps in the graph may indicate moments when the mouthguard was not recording, such as when it was removed from your mouth.
Heart Rate Zones
This section displays a color-coded breakdown of the time spent in each heart rate zone throughout your session. Each zone corresponds to a specific range of beats per minute (BPM) and is designed to represent different levels of exertion, from light to very intense. The zones are personalized according to your age and fitness level.
Heart Rate Details
This section displays the Most Active Heart Rate Zone, Average, Maximum and Minimum Heart Rate over the Session.
Difficulty
Difficulty, also known as the Rate of Perceived Exertion (RPE), is a personal score that captures the intensity of your workout on a scale from 1 to 10. By logging this post-session, you reflect your personal assessment of effort.
Workload
Shows the stress felt by the athletes body during a session, derived from duration, difficulty, and heart rate.
Movement
The ORB Sport Smart Mouthguard gauges the responsiveness and mobility of your movements. Movement is represented as a percentage to indicate high, medium, or low intensity. Using your height, we estimate the distance travelled by calculating your stride length and steps taken.
Movement Intensity
Movement Intensity amplifies and highlights periods of high activity, making them stand out against lower activity periods. It shows the athletes mobility level at any given moment, normalized between 0 and 1.
Average Movement Intensity
Taken from the graph above, an average is given based on the athletes entire session, between 0 and 1.
Movement Intensity Zones
Movement Intensity Zones shows the percentage of time the athletes spent at high, medium and low intensity.
Distance
Steps Chart
This chart shows the number of steps taken throughout a session. It visually tracks your step count over time, providing a moment-to moment look at your activity level and helps illustrate periods of higher and lower physical movement.
Distance Details
This section shows the Total Steps you took over your Session and an estimate of the distance you traveled.
Impacts
The ORB Sport Smart Mouthguard tracks total linear g-force in three dimensions (x, y, z) to present clear impact data. This data is broken down to show the g-force recorded on each side of the head.
Linear Resultant G-Force Graph
The graph shows the linear G-force experienced during the session. The graph shows aggregates forces from all three axes, X, Y, and Z, to give an overview of the impacts sustained.
Impact Region
Impact Region displays the percentage of impacts detected by the mouthguard on the left side versus the right side of the head.
Impact Region Difference
This parameter indicates the difference in the percentage of impacts felt between the left and right sides.